
QQube Data Warehouse for QuickBooks
Create custom reports without building the data model first
QQube Data Warehouse for QuickBooks
Create custom reports without building the data model first
QQube is More Than a Connector
A CONNECTOR → Extracts QuickBooks data.
QQUBE → Organizes and prepares it for reporting.
Save days or weeks of reverse engineering and associated development costs.
What a Raw Connector Leaves to You
You still have to interpret transactions, create relationships, resolve SDK limitations, and build the accounting logic and calculations required for reporting.
What QQube Already Prepares
Relationships, accounting logic, calculated fields, multiple-company structure, examples, and ready-to-use DAX measures are prepared for reporting before you start building.
Prepared does not mean locked. QQube prepares the QuickBooks data foundation while you retain control over the reports, calculations, filters, visuals, queries, and presentation.
Start Reporting in Three Steps
1. Connect
Connect one or more QuickBooks company files to QQube
2. Synchronize
Select the data models you need and run the QQube synchronizer.
3. Report
Open an included example, customize it, or build your own.
Reporting Across Your Business
Explore comprehensive reporting models for financial, sales, purchasing, inventory, job costing, payroll, accounting, and operational reporting.
Financial Reporting and Core Standards
Create financial statements, cash flow reports, budgets, forecasts, and period comparisons.
Sales and Accounts Receivable
Analyze sales, customers, receivables, payments, credits, discounts, and related activity.
Job Costing, Time, and Mileage
Track job profitability, labor, time, mileage, costs, billing, and customer activity.
Inventory and Bill of Materials
Analyze inventory quantities, values, sales, purchases, assemblies, components, and demand.
Purchasing and Accounts Payable
Analyze vendors, purchases, bills, payments, expenses, and accounts payable activity.
General Ledger and Accounting
Review general ledger detail, trial balance activity by period, and profit and loss detail.
Payroll and Human Resources
Analyze payroll detail, earnings, deductions, taxes, time, and human-resource information.
Audit and Compliance
Review audit trails, changed or deleted transactions, user activity, and compliance details.
Use the Reporting Applications You Already Know
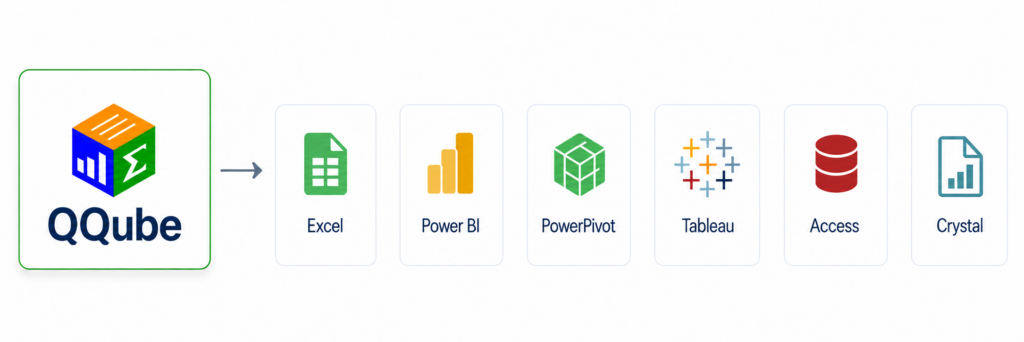
QQube organizes and prepares your QuickBooks data for each reporting application—complete with relationships, accounting logic, calculations, and reporting structure—so you can open an included example or start building immediately.
Excel
Build familiar spreadsheet analyses and traditional financial reports using included PivotTable and dynamic-range examples.
Power BI
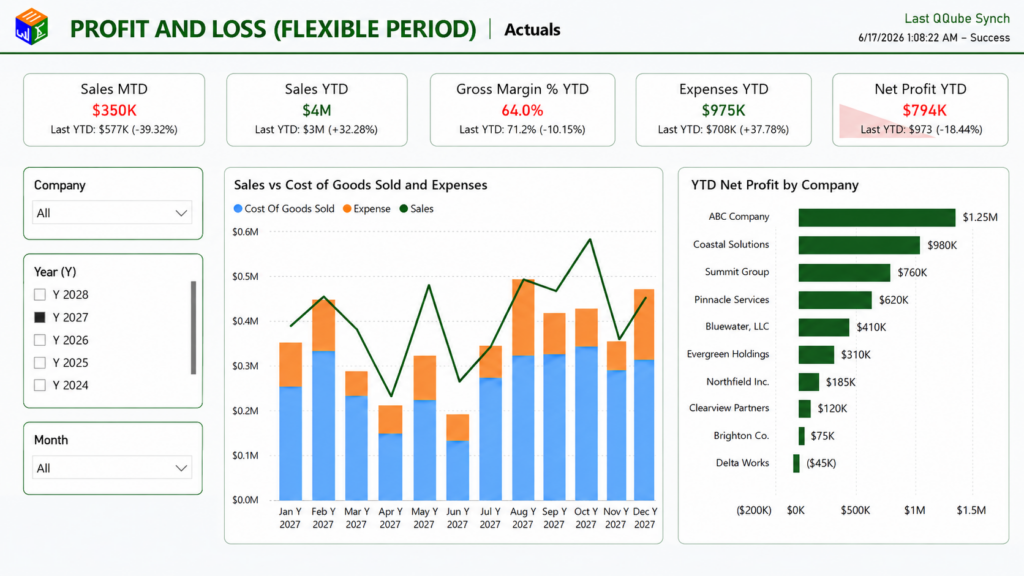
Build interactive dashboards, publish reports to the Power BI service, and combine QuickBooks with budgets and other business data.
Crystal Reports
Create detailed, precisely formatted, print-ready reports with exact positioning, complex layouts, and high-volume output.
Report Across Multiple QuickBooks Companies
QQube automatically combines information from multiple QuickBooks company files so you can consolidate, compare, filter, and report across companies without manual exports or repeated copy-and-paste work.
Consolidate and Compare
Combine multiple QuickBooks company files into one reporting environment with consistent company identification.
Create consolidated reports, compare companies, filter individual entities, and refresh everything from one centralized process.
Three Decades of QuickBooks Reporting Expertise
CLEARIFY has worked with QuickBooks reporting and data access for more than three decades, including direct involvement with Intuit data-access initiatives and the introduction of QQube in 2010.
QuickBooks Data Access
Working with QuickBooks reporting and data access since Intuit introduced the SDK in 2001.
Direct Work with Intuit
Contributed to Intuit data-access initiatives, including Business Analysis and related implementations.
QQube Since 2010
Introduced QQube in 2010 and continue expanding its data models, reporting examples, and calculations.
Testimonials
See What People Have to Say About Us

Biagio LaRosa
Business Owner
Highly recommended!
We have built such extensive Power BI visuals based on QQube that they run our company. Without QQube, we would move to NetSuite So we saved over $$$ per year!

Mario Nowogrodzki
CPA CITTP Owner
Improves Decision-Making
QQube is the de facto standard in all things related to QuickBooks analytics and reporting. As consultants, it boosts our ability to create value with less effort.

Amy Brown
Controller
Easy to use
We looked at connectors and other solutions, but none compared to the capability and simplicity of QQube. We can’t begin to tell you how many hours it has saved us.
Start Reporting with QQube
Stop building reports from raw QuickBooks data. Start with QuickBooks data organized and prepared for reporting, then customize the reports for your organization.